
When my younger son grabs a book or a toy from his older siblings without permission, his line of defense is always the same: “Sharing is caring!” Our kids' schools teach and reinforce this philosophy. Likewise, our family has rules to ensure peaceful, orderly sharing.
Similarly, many organizations value collaboration. They encourage researchers, data owners, data scientists and business analysts to share work product and ideas and facilitate it among their teams. As with families, they often find it easier said than done.
A big part of my job is to meet customers and advise them on how SAS technology can help solve their business challenges. A recurring topic has been around SAS Viya, the analytics capabilities collectively known as the SAS® Platform. I emphasize how SAS Viya seamlessly enables collaboration across diverse users and teams.
SAS Viya collaboration use case with Commitments of Traders data
How does it work in real life? Here is an example to demonstrate how SAS coders and business analysts can easily collaborate on SAS Viya. I am using a publicly available data set known as Commitments of Traders (COT) that the U.S. Commodity Futures Trading Commission (CFTC) publishes on its website (https://www.cftc.gov/MarketReports/CommitmentsofTraders/index.htm.) Traders and researchers closely watch and analyze this data set for trends and price movements in the commodities market.
A SAS programmer readies the data
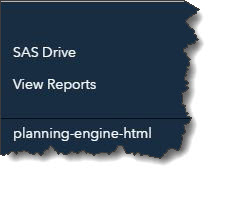
First, I need to bring the original COT file, saved in ‘.txt’ format, to my enterprise SAS environment. On SAS Viya, I have a choice of using a programmatic or graphical user interface (GUI) approach to import data and perform data wrangling/preparation. Both interfaces are easily accessible from a drop-down menu on SAS Drive, a web-based central hub for SAS Viya applications (see Figure 1). I choose the programmatic approach by clicking on Develop SAS Code from the drop-down menu.
SAS® Studio, the programming interface for SAS Viya, is a web-based development environment that includes code autocomplete, a library of frequently used code snippets, pre-built GUI wizards for numerous analytical routines, etc.
In SAS Studio, I prepare the data with five steps: 1) Import the raw text file; 2) Reduce the number of variables; 3) Compute the traders’ net position; 4) Import the mapping table; and 5) Add the commodity category variable from the mapping table. For all of these steps, I use SAS DATA Step and PROC statements that have been around for 40+ years – old school SAS.
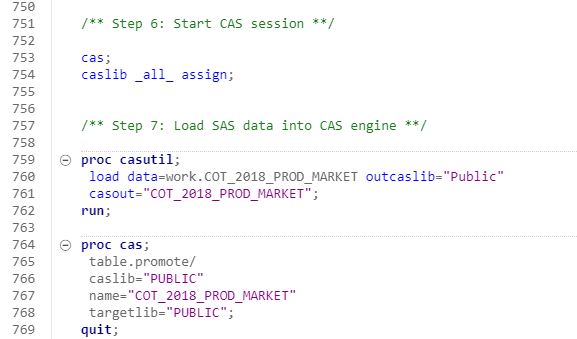
The last two steps in my program, Step 6 and Step 7, are unique to SAS Viya (see Figure 2 below.) Those lines of code start the Cloud Analytics Server (CAS) session and load the final curated table into CAS, an in-memory distributed analytical engine that I consider the “heart and soul” of SAS Viya. Once the data is in CAS, an authorized user of my enterprise SAS Viya environment can easily locate data in CAS library/catalog for data exploration, modeling, or developing business intelligence content.
A business analyst creates and shares an interactive dashboard
Now it's the business analyst's turn. In this example, my teammate wants to build an interactive dashboard using curated COT data that I (the programmer) loaded into CAS. The analyst will access SAS Drive, select Explore and Visualize Data option from the menu, and be directed to SAS Visual Analytics, a web-based application that allows you to explore data and build point-and-click, interactive visualizations, no coding skills required.
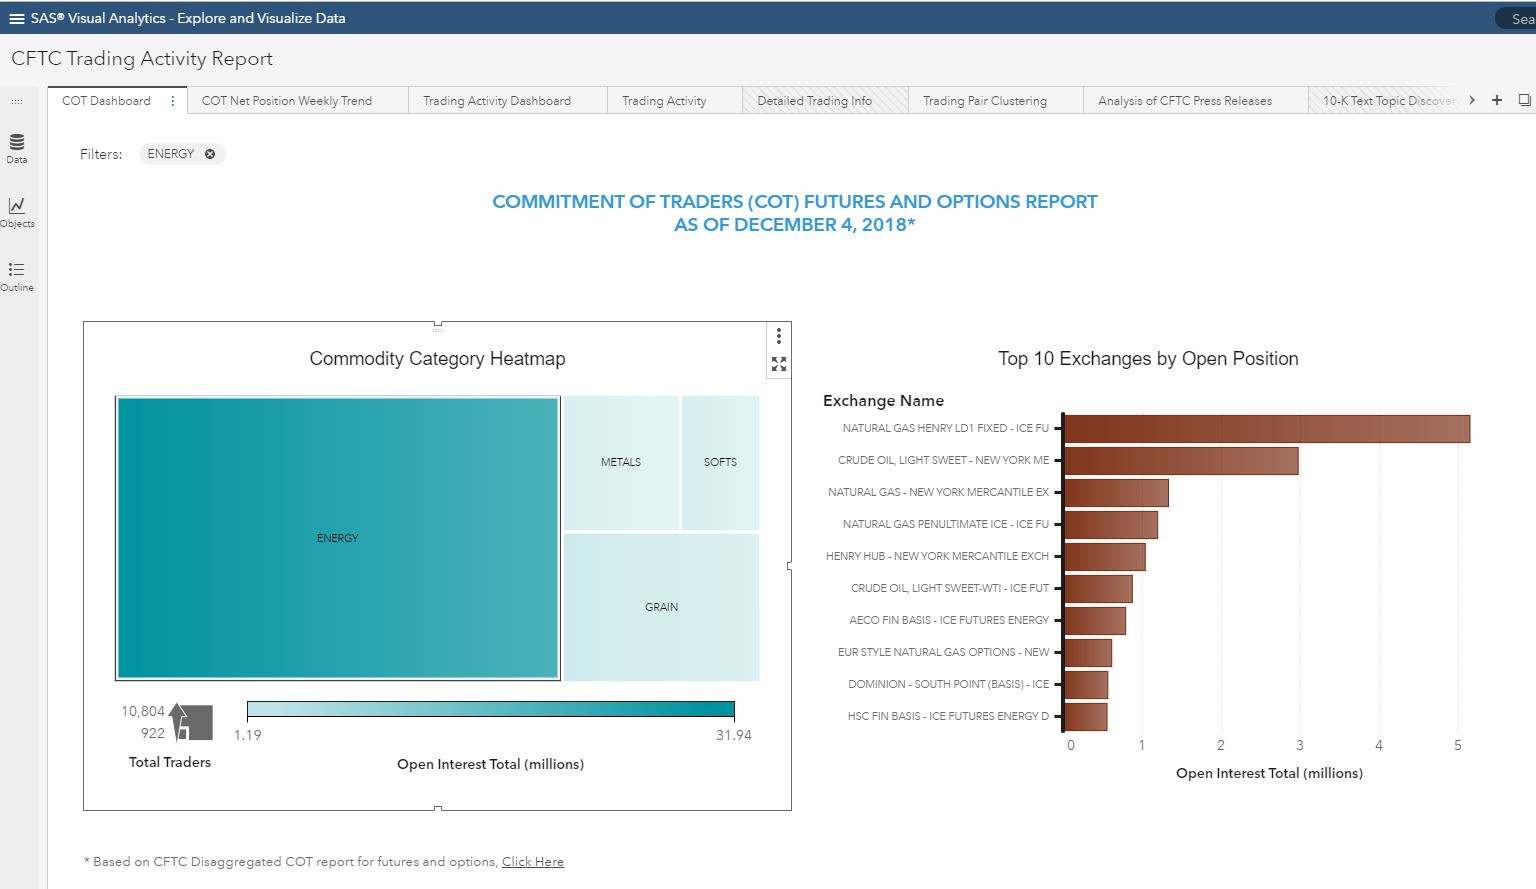
Figure 3 and Figure 4 below show examples of the types of drillable dashboards and reports you can easily develop in SAS Visual Analytics with a few clicks. You can share the report internally via web link, view it in MS Office products, or publish it on the intranet or external facing website.

Collaboration bridges diverse skill sets, fosters successful projects
Studies show that success of any analytical project requires multi-disciplinary teams that include database administrators, data scientists, analysts, subject matter experts, management and IT support. SAS Viya helps them capitalize on their strengths to promote frictionless collaboration in a secure and controlled environment.
This post, focused on collaboration between SAS coders and business analysts, only scratches the surface of SAS Viya's collaboration and knowledge sharing capabilities. Likewise, open source coders (R and Python) and business analysts can collaborate on SAS Viya too.
Free trials below give programmers and business analysts a taste of what's possible with SAS Viya. Try one and tell us about it in the comments.
SAS® Visual Analytics on SAS® Viya® | Try it as a business analyst! SAS® Visual Analytics on SAS® Viya® | Try it as a programmer!